The Ultimate B2B Founder’s Guide to Google Analytics 4 (GA4)
If you have logged into your Google Analytics account recently, you likely experienced a mild panic attack. The familiar interface is gone, the reports you relied on for a decade have vanished, and simple metrics like "Visits" have been replaced by confusing terms like "Events" and "Parameters."
You are not alone. The mandatory migration to Google Analytics 4 (GA4) has been a massive source of stress for millions of marketing directors and B2B founders worldwide. Because of this, many companies use this incredibly powerful enterprise tool at 5% of its capacity—just to see "how many people visited the site yesterday."
The truth is, the old Universal Analytics was built for the desktop era. GA4 is engineered for the era of multi-platform journeys, strict privacy regulations, and complex B2B sales cycles.
In this foundational playbook, we will tear down GA4 to its core architecture. No fluff, no complex code, and no confusing jargon. Just the exact engineering setup you need to stop burning your marketing budget.
Part 1. The Paradigm Shift: Why GA4 is a Revolution, Not an Update
To read the numbers correctly, you must understand the underlying database logic. The fundamental difference between GA4 and the old version is the data model.
1. Everything is an Event (The Event-Based Model)
In the old analytics, the core unit of measurement was the "Session" (the visit). In GA4, the core unit is the Event.
- A page view is an event.
- Clicking a "Request Demo" button is an event.
- Scrolling down a pricing page is an event.
- Downloading a PDF case study is an event.
Why does this matter for B2B? Previously, we only counted how many times someone "walked into the store." Now, we mathematically track exactly what they touched, read, and engaged with. This is crucial for tracking complex behavior on modern Single Page Applications (SPAs) and highly interactive Webflow architectures.
2. The Death of "Bounce Rate"
Historically, CMOs panicked if their Bounce Rate hit 70%. It meant 70% of users left after viewing only one page. But if you have a perfectly engineered landing page where the client lands, reads the entire offer, calls your sales team, and leaves—that is a massive success, not a bounce!
GA4 replaces this flawed logic with a new metric: Engaged Sessions.A session is counted as "engaged" if the user:
- Spends more than 10 seconds on the site;
- OR completes a conversion event;
- OR views 2 or more pages.
We are no longer measuring the people who ran away; we are measuring the people who stayed to listen.
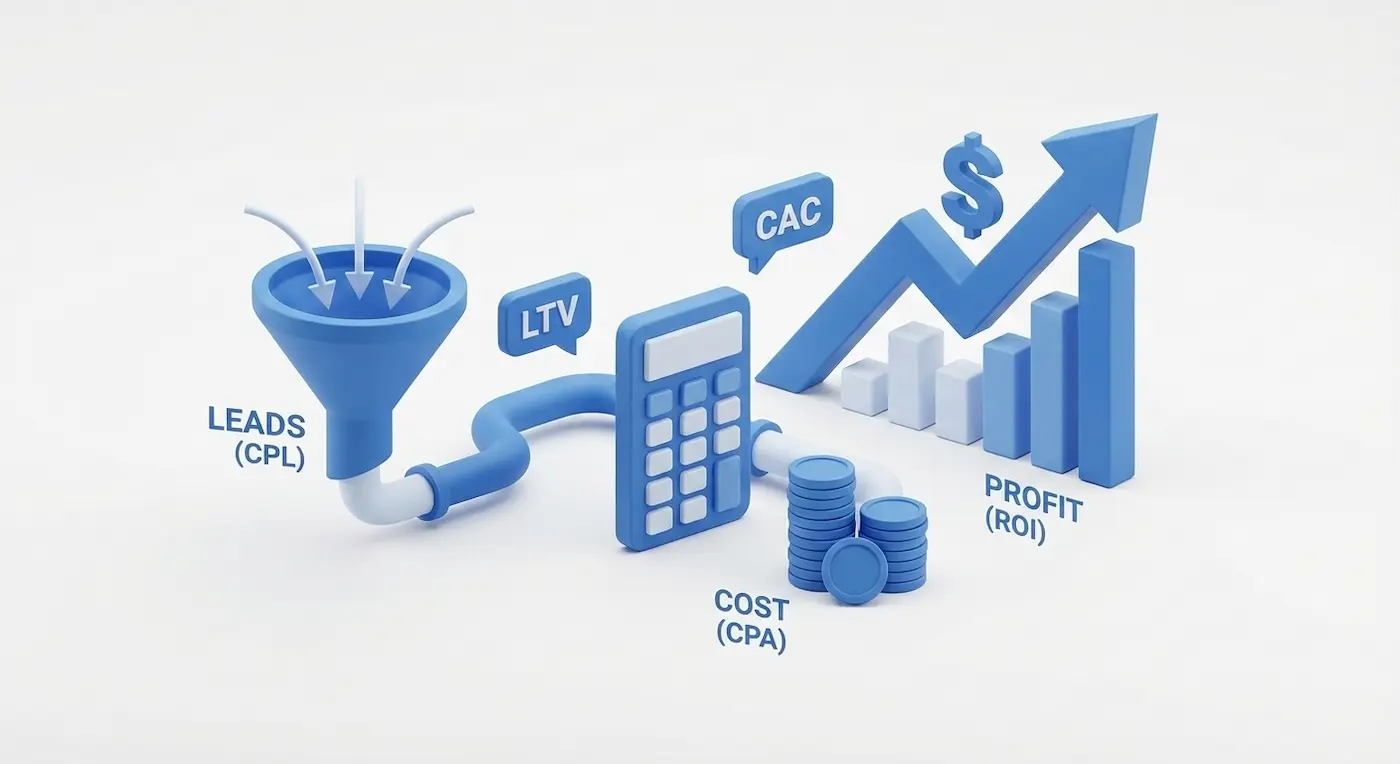
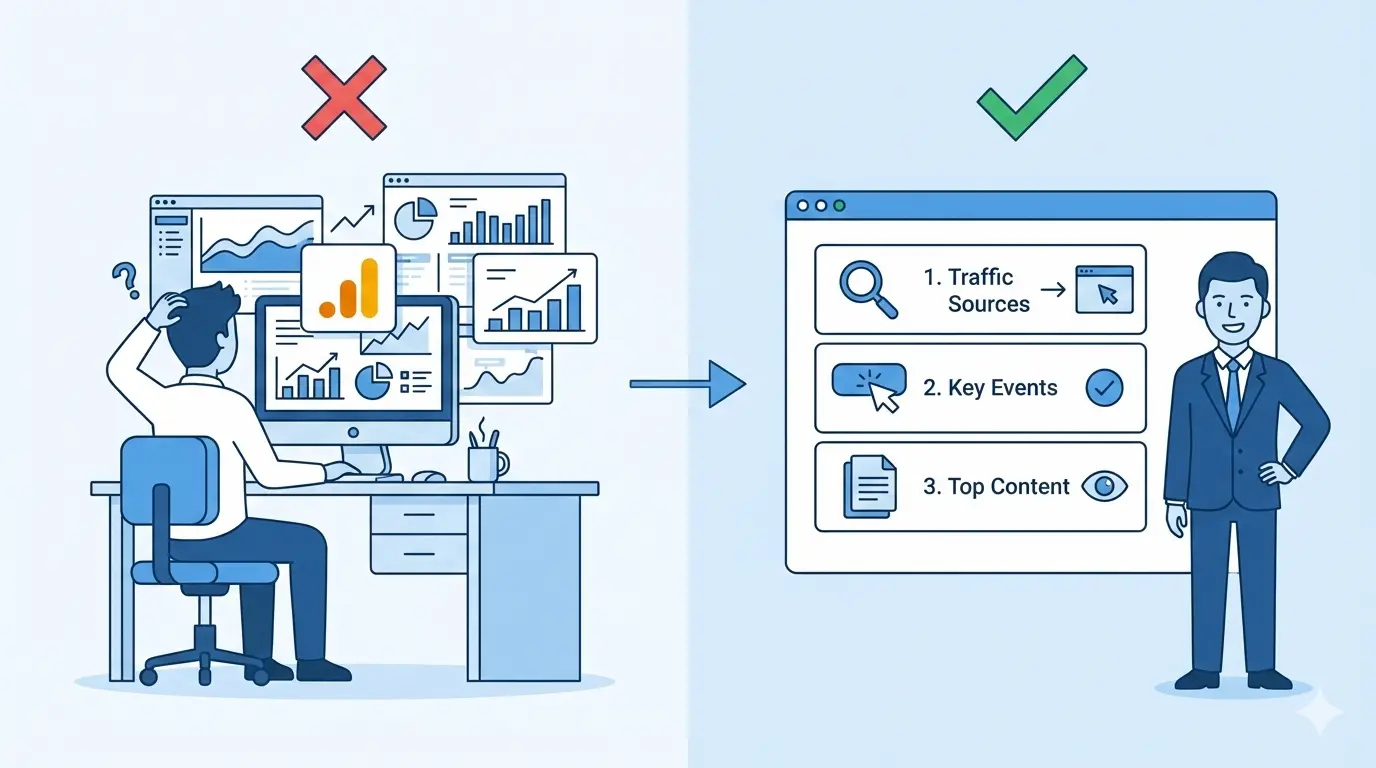
Part 2. The Only 3 Reports That Answer: "Where is the ROI?"
The GA4 menu has dozens of buttons. But for daily pipeline control, you only need three reports. Let’s configure the navigation in your mind.
1. Traffic Acquisition: Where are the leads coming from?
- Path:
Reports→Acquisition→Traffic acquisition
This is where we audit the performance of your SEO and paid advertising. Focus entirely on the Session source/medium column.
google / organic: Your inbound SEO pipeline. Free traffic.linkedin / cpcorgoogle / cpc: Your paid advertising budget.direct / (none): Direct traffic (bookmarks or typing your URL).
💡 Engineering Advice: Always cross-reference your traffic sources with the Engagement Rate. If your linkedin / cpc engagement is 10%, but your google / organic is 60%, your ad targeting is broken. You are paying thousands of dollars for digital "tourists," not qualified B2B buyers.
2. Pages and Screens: What are they reading?
- Path:
Reports→Engagement→Pages and screens
This report shows which landing pages generate pipeline and which ones are dead weight.
- Views: Your most trafficked digital real estate.
- Average engagement time: Are B2B buyers actually reading your 2,000-word case study, or are they abandoning it after 5 seconds due to poor UX?
3. Funnel Exploration: Where are they dropping off?
This is the most devastatingly powerful feature in GA4, and it is hidden. It is not in the standard "Reports"—it lives in the Explore tab.
You can custom-build your B2B sales pipeline step-by-step:
- Landed on Homepage.
- Clicked "Enterprise Solutions".
- Viewed Pricing Page.
- Started "Request Demo" form.
- Successfully Submitted form (
generate_lead).
GA4 will calculate the exact percentage of drop-off between each step. If you lose 80% of users between Step 3 and Step 4, your form is likely too long, or there is a critical UX error in your architecture.
Part 3. Engineering Events & Key Events (The Heart of GA4)
GA4 tracks basic events automatically. But to calculate ROI, you must track Key Events (formerly known as Conversions)—the specific actions that generate revenue.
Option A: Google Tag Manager (The Enterprise Standard)Professional engineers configure everything through GTM. It acts as an architectural layer between your site and GA4.
- We create a Trigger (e.g., "User clicked CSS class
.btn-demo"). - We fire a GA4 Event Tag named
generate_lead. - The data is securely passed to Analytics.
Option B: The GA4 Interface (The Quick Fix)You can engineer an event based on a destination URL.
- Scenario: If a user reaches
[site.com/thank-you](https://site.com/thank-you), they successfully submitted a lead form. - Path:
Admin→Events→Create event. - Logic: If
page_locationequals/thank-you, fire the eventgenerate_lead. - CRITICAL: Once the event appears in your list (usually 24 hours later), you must toggle the switch: Mark as Key Event. If you forget this, it will not track as a conversion in your Google Ads reports.
Part 4. The Top 5 Setup Mistakes Ruining Your Data
After auditing dozens of enterprise accounts, we found these 5 critical configuration errors in 90% of them. Fix these immediately.
- Mistake 1: Default Data Retention. By default, GA4 only stores granular user data for 2 months. If you try to run a Q1 vs. Q3 comparison, you will see a blank screen.
- The Fix: Go to
Admin→Data collection and modification→Data retention. Change it from 2 months to 14 months today.
- The Fix: Go to
- Mistake 2: Tracking Internal Traffic. Your team checks the live site 20 times a day. If GA4 counts these, your conversion rates will look artificially low.
- The Fix: Engineer an internal IP filter in your Data Streams settings.
- Mistake 3: Zero UTM Tagging. If you run a sponsored post in an industry newsletter and just link to
yoursite.com, GA4 categorizes it asdirect / (none). You will never know the ROI of that campaign.- The Fix: Use strict UTM parameters for every external link.
- Mistake 4: Duplicate Tracking Codes. When migrating, founders often leave the old Universal Analytics code embedded or fire GA4 twice (once via GTM, once hardcoded).
- The Result: Every visitor is counted twice. Your bounce rate drops to an impossible 2%, completely destroying data integrity.
- Mistake 5: Google Signals Disabled. If you want advanced demographic data or wish to run complex retargeting campaigns, you must activate Signals.
- The Fix:
Admin→Data collection→Google signals→ Enable.
- The Fix:
Summary
Google Analytics 4 is not just a traffic counter. It is a business intelligence platform. Do not try to memorize every chart. Start with the engineering basics:
- Extend data retention to 14 months.
- Configure 2 strictly defined Key Events (e.g., Demo Booked, Form Submitted).
- Audit your "Traffic Acquisition" report every Monday morning.
Data architecture should not be intimidating. It should be profitable.
Is your GA4 data broken, double-counting, or failing to track leads? We specialize in enterprise-grade analytics configurations and Webflow tracking architecture. Let’s clean up your data so you can finally trust your marketing ROI.
👉 Book a Technical Analytics Audit Today.
Read new articles:


Рентабельные рекламные кампании в Яндекс.Директ
Настроим и будем вести контекстную и таргетированную рекламу для вашего бизнеса
Создадим систему привлечения новых клиентов
Уменьшим цену входящего звонка и заявки
Увеличим заказы на маркетплейсах: Ozon, Yandex Market, WB
Подготовим понятные отчеты и аналитику

