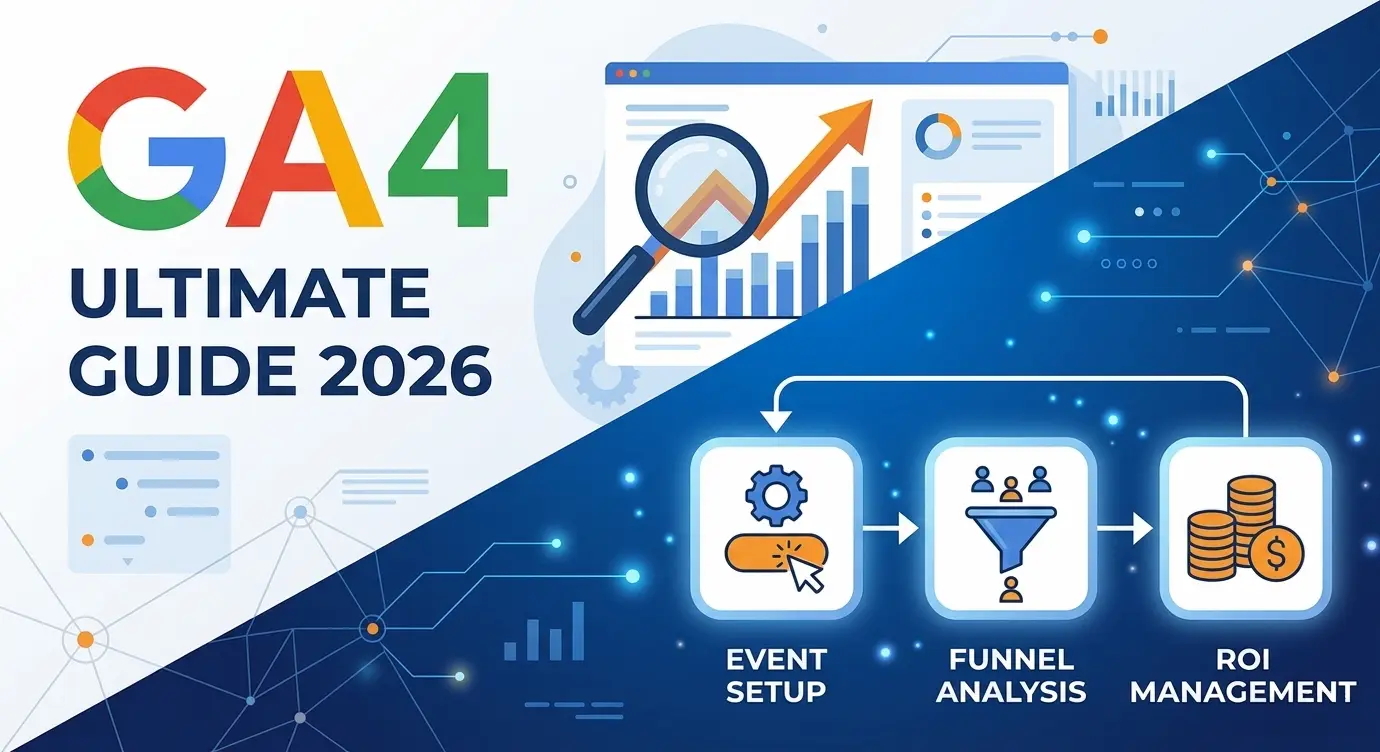
Google Analytics 4 (GA4) for B2B Founders: The Only 3 Reports You Actually Need
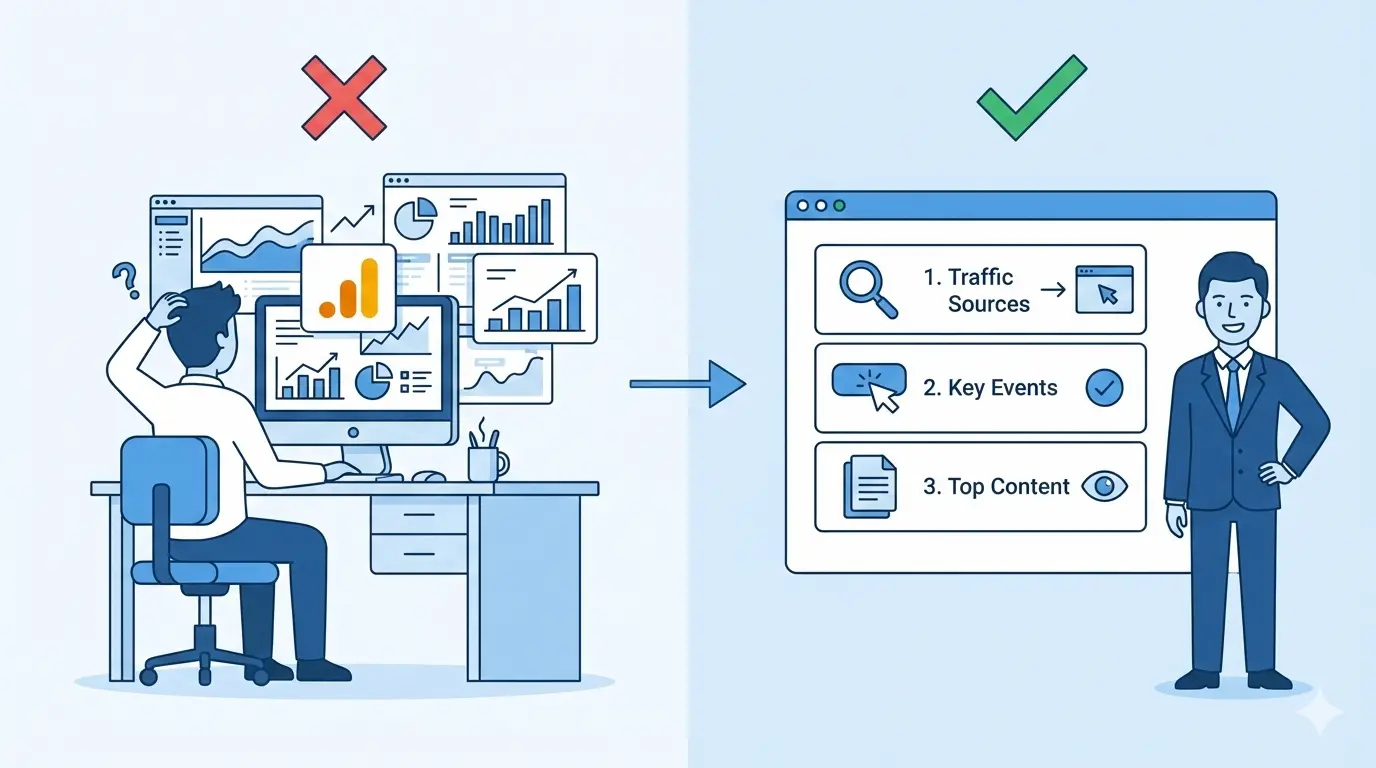
The Analytics Paralysis
You open Google Analytics to see how much traffic your new marketing campaign generated yesterday, and... you freeze.
You are instantly overwhelmed by hundreds of buttons, abstract charts, and confusing jargon like "Cohorts," "Data Streams," and "User Engagement." Instead of clear answers, you get a headache. As a result, 90% of business owners simply close the tab and continue running their enterprise completely blind.
Here is the good news: You do not need to be a data scientist to manage your digital pipeline. Out of the hundreds of complex reports hidden inside GA4, a B2B founder truly only needs three.
These three reports answer the only questions that matter: Where did the money come from? What did they do? What did they read? Let's cut through the noise and learn how to read your revenue, not just abstract numbers.
Report 1: Where is the Money Coming From? (Traffic Acquisition)
This is the ultimate report for auditing your marketing agency. It shows exactly which channels are generating qualified leads (like organic SEO) and which are just burning your budget.
- Where to find it:
Reports→Acquisition→Traffic acquisition - What to look for: Scroll down to the table and look at the Session source/medium column.
💡 The Business Insight: Look at the Engagement Rate column. If your paid traffic (cpc) has an engagement rate below 30-40%, you are paying for garbage traffic. People are clicking the ad, seeing your site, and immediately bouncing. You need to pause the campaign and fix your targeting immediately.
Report 2: What Are They Doing? (Events & Key Events)
In the old Universal Analytics, everyone obsessed over "Bounce Rate." GA4 completely changed the architecture: everything is now built around Events. A click, a scroll, a video view—these are all events.
But as a founder, you don't care about every random click. You only care about the clicks that generate pipeline. In GA4, these are called Key Events (formerly known as Conversions).
- Where to find it:
Reports→Engagement→Events - What to look for: Search for the specific event names that directly impact your sales:
generate_lead(Form submissions)book_meeting(Calendly or scheduling clicks)file_download(Downloading a B2B whitepaper or pricing PDF)
💡 The Business Insight: If Report #1 shows you had 1,000 paid visitors, but this report shows only 2 generate_lead events, your conversion rate is an abysmal 0.2%. This is a disaster. It means the problem is not your ad budget; the problem is your website's UX architecture. Your forms are too long, or your offer is unclear.
Report 3: What Are They Reading? (Pages and Screens)
This report shows you exactly which content is capturing attention and which pages are causing users to flee in terror.
- Where to find it:
Reports→Engagement→Pages and screens - What to look for: The table will list the actual URLs of your website (e.g.,
/,/enterprise-services,/blog/case-study).- Views: Your most popular digital real estate.
- Average engagement time: If users spend 10 seconds on a 2,000-word case study, your formatting is unreadable. If they spend 3 minutes, you have a winning asset.
💡 The Business Insight: Look for pages with massive traffic volume but terrible engagement times. These are the "holes" in your bucket where potential revenue is leaking out. You need to re-engineer the UX on those specific pages, rewrite the headlines, or add a clearer Call-to-Action (CTA).
Summary: Stop Overcomplicating Data
Google Analytics 4 is a devastatingly powerful tool, but its true power lies in business decisions, not in staring at pretty charts.
Set up a simple, 5-minute weekly routine:
- Open Traffic Acquisition: Is our inbound pipeline growing?
- Open Events: Did we actually get any qualified leads?
- Ignore everything else until you have a specific business reason to dig deeper.
Data should help you generate revenue, not steal your time with endless riddles.
Is your GA4 showing a high bounce rate and zero leads? The problem is likely your website's architecture. Let's schedule a UX & Conversion Audit to find exactly where your B2B buyers are dropping off.
Read new articles:


Рентабельные рекламные кампании в Яндекс.Директ
Настроим и будем вести контекстную и таргетированную рекламу для вашего бизнеса
Создадим систему привлечения новых клиентов
Уменьшим цену входящего звонка и заявки
Увеличим заказы на маркетплейсах: Ozon, Yandex Market, WB
Подготовим понятные отчеты и аналитику

