The 100/100 PageSpeed Myth: Why B2B Brands Should Focus on Core Web Vitals Instead
There is an obsession that haunts B2B founders and marketing directors. It usually starts when someone on the team runs the company website through Google PageSpeed Insights (PSI) and sees a terrifying red circle.
The score is 45/100. Panic ensues. "Our site is incredibly slow! Google is going to penalize us! We are losing clients! We need a 100/100 score immediately!"
The development team is then tasked with achieving the coveted "green zone." What follows is a frantic race where functionality, premium design, and vital marketing tools are sacrificed on the altar of a vanity metric.
But here is the industry secret: Google’s own search page often doesn't score a 100. Amazon hovers around 50. YouTube sits near 60 on mobile. Does this stop them from generating billions in revenue? No.
Let's break down why the overarching PageSpeed score is often a misleading metric, and which three technical indicators actually dictate whether a user buys or bounces.
Why the PageSpeed Score "Lies"
Google PageSpeed Insights primarily shows you Lab Data. To run the test, Google simulates a mid-tier, aging smartphone (like a Moto G4) operating on a throttled, slow 4G network.
Your Webflow site might load instantly on your client's iPhone 15 Pro on corporate Wi-Fi, but PSI will still show 50 points because its "robot tester" is deliberately handicapped.
Chasing a strict 100/100 score is often detrimental to B2B companies because:
- To achieve it, developers usually have to rip out third-party scripts. This means deleting your Intercom live chat, your HubSpot tracking, the LinkedIn Insight Tag, and dynamic interactive maps.
- The resulting site will be mathematically fast, but stripped bare and useless for complex performance marketing.
You have to ask yourself: Do you want a vanity metric, or do you want a high-performance sales asset?
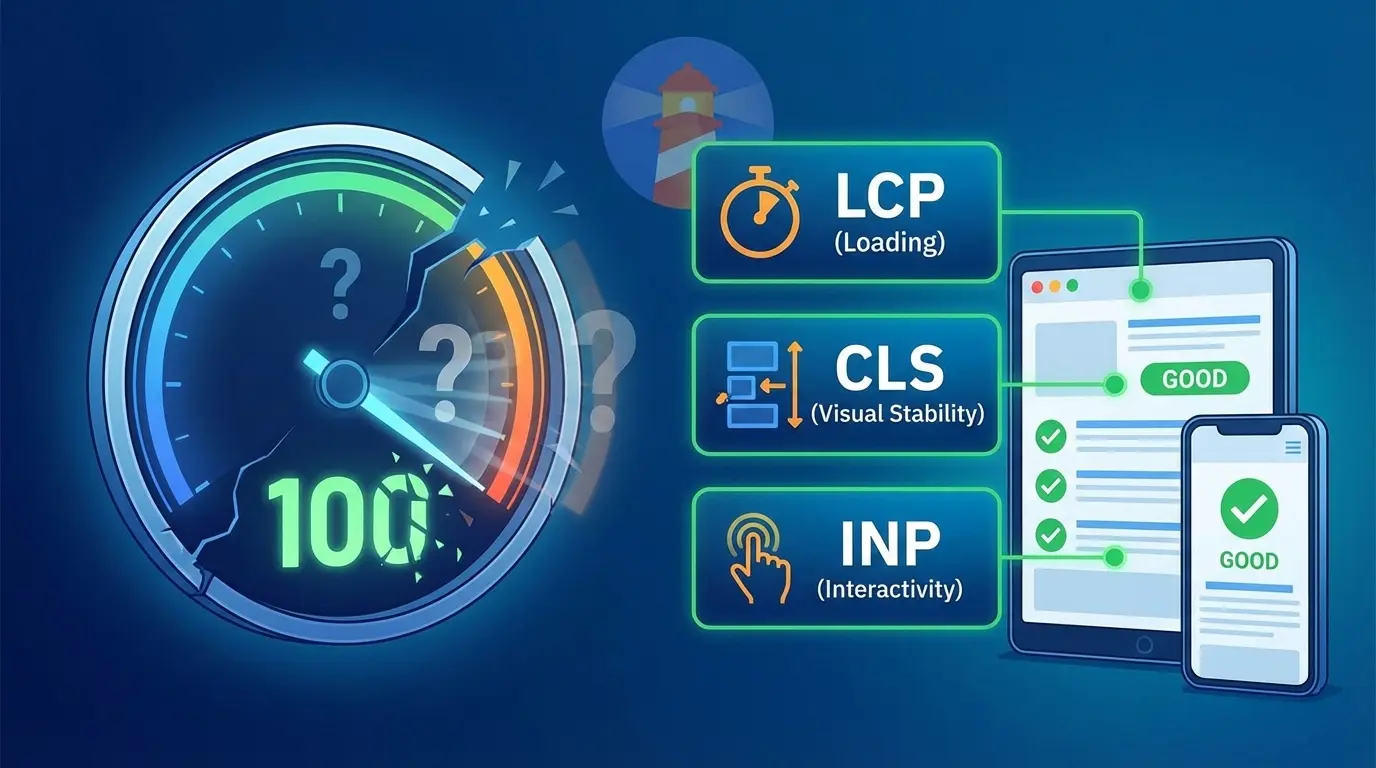
Core Web Vitals: The Holy Trinity of UX
In 2021, Google officially clarified its algorithm: the overarching PSI score is just a guideline. For actual SEO ranking and user experience evaluation, Google uses Core Web Vitals.
There are only three. If these metrics are in the "Good" zone, Google considers your site technically sound, even if your overarching mobile score is a 55.
1. LCP (Largest Contentful Paint) — Loading Speed
Translation: "How fast do I see the most important thing?"This measures how long it takes for the largest element above the fold (usually the H1 headline or the hero image) to render fully.
- Good: Under 2.5 seconds.
- Poor: Over 4.0 seconds.
- The Engineering Fix: Serve images in next-gen formats (WebP/AVIF), utilize a global AWS CDN, and avoid render-blocking JavaScript in the
<head>tag.
2. CLS (Cumulative Layout Shift) — Visual Stability
Translation: "Does the content jump around?"This is the most frustrating UX flaw. You visit a site, go to tap the "Book Demo" button, but a late-loading banner pushes the content down, causing you to click the wrong link. This is a high CLS.
- Good: 0.1 or less (almost no shifting).
- The Engineering Fix: Hardcode
widthandheightattributes for all media, pre-allocate space for dynamic ad banners, and use system font fallbacks.
3. INP (Interaction to Next Paint) — Responsiveness
Translation: "How fast does the site react to my tap?" (Note: This recently replaced the old FID metric). You tap the mobile hamburger menu, but it takes a full second to open. The site feels "frozen."
- Good: Under 200 milliseconds.
- The Engineering Fix: Defer non-critical JavaScript and optimize the browser's main thread so it isn't choked by complex calculations.
Mobile vs. Desktop: The Score Discrepancy
You have likely noticed a massive gap in your reports: the Desktop tab shows 95/100, while the Mobile tab shows 48/100.
Why the chasm? Mobile devices have significantly weaker CPUs and unstable network conditions. Google judges them much more harshly.
Here are the realistic benchmarks for a modern B2B website:
- Desktop: 80–100 (Green Zone). This is standard and relatively easy to achieve with clean code.
- Mobile: 50–80 (Orange Zone). This is completely normal! If your site is built on Webflow, features fluid animations, embeds a HubSpot form, and runs a live chat, a mobile score of 55 is the industry standard. If the site feels subjectively fast to a human, do not torture your developer.
The Usual Suspects: What Actually Kills Your Speed?
If your site is genuinely taking 5-7 seconds to load, it is likely suffering from these common architectural flaws:
- Uncompressed Assets: An art director uploaded a 10MB, 5000px JPG image directly to the hero section. This is a death sentence for mobile networks.
- Third-Party Bloat: Every widget (Hotjar, Intercom, Calendly) requires an external server request. Stacking 5 widgets can cut your speed in half.
- Mobile Video Backgrounds: They look cinematic, but they consume massive bandwidth. Engineers should disable heavy auto-playing videos on mobile breakpoints and serve a highly optimized fallback image instead.
- Font Loading: If you load 8 different font weights (from Light to Black) via Google Fonts, the browser halts rendering until they are all downloaded.
Summary
Common sense should always overrule abstract numbers. Do not chase the 100/100 vanity metric at the expense of your business logic.
Your ultimate goal is frictionless user experience.Take out your phone, turn off Wi-Fi, and load your site on a standard cellular network:
- Did the main headline appear quickly? (LCP)
- Did the layout remain perfectly still? (CLS)
- Did the menu open instantly when tapped? (INP)
If yes, your technical foundation is solid. Stop investing your budget in endless, marginal code optimizations, and redirect those funds into high-quality content and performance marketing.
👉 Not sure if your site is actually fast or just heavy? Book a Core Web Vitals Audit, and I will show you exactly what is holding your conversions back.
Read new articles:


Рентабельные рекламные кампании в Яндекс.Директ
Настроим и будем вести контекстную и таргетированную рекламу для вашего бизнеса
Создадим систему привлечения новых клиентов
Уменьшим цену входящего звонка и заявки
Увеличим заказы на маркетплейсах: Ozon, Yandex Market, WB
Подготовим понятные отчеты и аналитику

